Introduction: From Chart-Blind to Chart Master
In 2016, I was the epitome of a fundamental analyst snob. "Charts are just pretty pictures," I'd say. "Real investing is about studying companies, not squiggly lines." Then I lost $25,000 in eight months buying "undervalued" stocks that kept getting more undervalued.
The final straw was buying Valeant Pharmaceuticals at $80 because the P/E ratio looked attractive. A quick glance at the chart would have shown a stock in free fall, breaking every support level. It eventually hit $9. My "cheap" stock cost me $8,000.
That disaster forced me to admit what every successful trader knows: price action tells you everything you need to know about supply and demand, fear and greed, and where the smart money is positioned. The chart doesn't lie – financial statements sometimes do.
I spent the next two years studying technical analysis obsessively. Books, courses, mentors, practice trading with paper money – I absorbed everything. Today, I use technical analysis to time entries and exits on all my investments, from swing trades to long-term portfolio positions. It's added over $150,000 to my returns by helping me buy low and sell high.
This guide shares everything I learned about reading charts like a professional trader, without the mystical nonsense or get-rich-quick promises. Technical analysis isn't magic – it's applied psychology and probability, and anyone can learn it.
Understanding What Charts Really Tell Us
The Foundation: Price is Everything
A stock chart shows the result of all fundamental analysis, insider knowledge, institutional positioning, and market sentiment distilled into one thing: price. Every buyer and seller, from Warren Buffett to day traders, votes with their money, and the chart records those votes.
The Four Types of Information:
- Price: What level buyers and sellers agree on
- Volume: How much conviction is behind moves
- Time: How long patterns take to develop
- Momentum: The rate of change in price movement
Why Technical Analysis Works:
Human Psychology is Predictable:
- Fear and greed create repeating patterns
- Crowds behave similarly across time
- Support and resistance levels matter psychologically
- Round numbers have emotional significance
Self-Fulfilling Prophecies:
- When enough traders see the same pattern
- Their actions make the pattern work
- Institutional algorithms use technical signals
- Creating feedback loops
My breakthrough moment: Realized that whether fundamentals "should" move a stock is irrelevant. What matters is what actually moves it, and charts show what's actually happening.
Chart Types and Time Frames
Line Charts: The Simplest View
- Shows closing prices connected by lines
- Good for seeing long-term trends
- Removes daily noise
- Best for beginners
Bar Charts: The Classic
- Shows open, high, low, close (OHLC)
- Vertical line with horizontal ticks
- More information than line charts
- Traditional choice for professionals
Candlestick Charts: The Visual Storyteller
- Same information as bar charts
- Color-coded for easy interpretation
- Shows bullish/bearish sentiment clearly
- My preferred chart type
Candlestick Anatomy:
- Body: Open to close (green/red)
- Wicks: High and low of session
- Doji: Open equals close (indecision)
- Hammer: Long lower wick (potential reversal)
Time Frame Selection:
Long-term Investors:
- Monthly charts: Major trends
- Weekly charts: Intermediate trends
- Daily charts: Entry/exit timing
Swing Traders:
- Daily charts: Main analysis
- 4-hour charts: Timing
- 1-hour charts: Precise entries
Day Traders:
- 1-hour charts: Setup identification
- 15-minute charts: Entry timing
- 5-minute charts: Trade management
My approach: Start with monthly for big picture, zoom into daily for entries, use hourly for precise timing.
Support and Resistance: The Foundation
Understanding Support and Resistance
Support: Price level where buying pressure historically emerges Resistance: Price level where selling pressure historically emerges
These levels matter because:
- Traders remember previous turning points
- Institutional algorithms trigger at key levels
- Psychology creates self-fulfilling prophecies
- Risk management rules cluster around these levels
Identifying Key Levels:
Horizontal Support/Resistance:
- Previous swing highs and lows
- Round numbers ($50, $100, etc.)
- 52-week highs and lows
- IPO prices or previous significant levels
Example: Apple stock repeatedly bounced off $150 support in 2022 before finally breaking lower. Each test created buying opportunities.
Dynamic Support/Resistance:
- Moving averages
- Trend lines
- Fibonacci retracement levels
- Bollinger Bands
Volume Confirmation:
- High volume at support/resistance = more significant
- Low volume breaks often fail
- Volume precedes price
- Institutional accumulation shows up in volume
My trading rule: Never buy without identifying the nearest support level for stop-loss placement.
Trend Analysis: Following the Smart Money
The Three Types of Trends
Uptrend:
- Higher highs and higher lows
- Series of successful breakouts
- Support holds on pullbacks
- Volume increases on moves up
Downtrend:
- Lower highs and lower lows
- Series of failed rallies
- Resistance holds on bounces
- Volume increases on moves down
Sideways/Range:
- Similar highs and lows
- Price oscillates between levels
- Low conviction from both sides
- Often precedes major moves
Trend Lines: The Roadmap
Drawing Trend Lines:
- Connect at least two swing points
- More touches = more significant
- Steeper lines break sooner
- Volume should confirm breaks
My Trend Line Rules:
- Draw from significant highs/lows only
- Must have at least 3 touches to be valid
- Break must be accompanied by volume
- False breaks common – wait for confirmation
Moving Averages: Dynamic Trend Lines
Simple Moving Average (SMA):
- Average of X periods
- Smooth out price noise
- 20, 50, 200 most common
Exponential Moving Average (EMA):
- Weights recent prices more heavily
- Responds faster to changes
- Better for shorter-term trading
Key Moving Average Strategies:
Golden Cross: 50-day MA crosses above 200-day MA (bullish) Death Cross: 50-day MA crosses below 200-day MA (bearish)
Real example: Tesla's golden cross in early 2020 preceded a 500% rally. The death cross in late 2022 preceded a 70% decline.
Chart Patterns: Reading Market Psychology
 Reversal Patterns
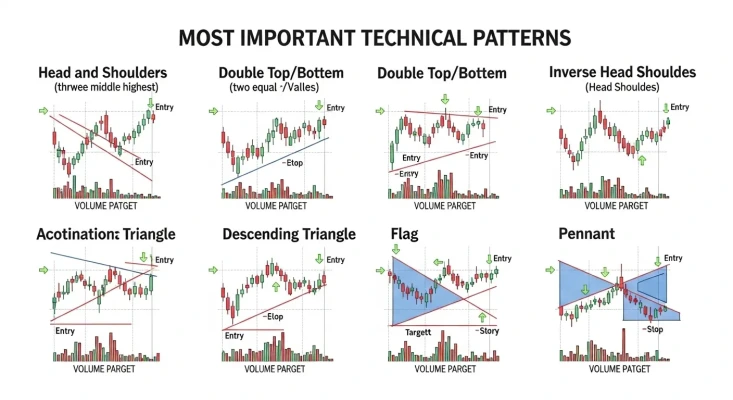
Head and Shoulders:
- Three peaks, middle highest
- Neckline connects reaction lows
- Volume should decline on right shoulder
- Target: Neckline distance projected down
My experience: Recognized head and shoulders in Netflix at $700 in 2021. Sold and avoided the drop to $162.
Double Tops and Bottoms:
- Two similar highs (tops) or lows (bottoms)
- Second test often on lower volume
- Break of middle reaction point confirms
- Reliable pattern when volume diverges
Inverse Head and Shoulders:
- Same as head and shoulders but inverted
- Bullish reversal pattern
- Look for volume expansion on breakout
- Often occurs at major market bottoms
Continuation Patterns
Triangles:
- Ascending: Higher lows, flat highs (bullish)
- Descending: Lower highs, flat lows (bearish)
- Symmetrical: Converging trend lines (direction unclear)
Flags and Pennants:
- Brief consolidation after strong move
- Flag: rectangular shape
- Pennant: small triangle
- Usually break in direction of prior move
Rectangles:
- Horizontal support and resistance
- Can break either direction
- Volume often decreases during formation
- Breakout direction often telegraphed by volume
Pattern trading success: Made $15,000 trading ascending triangle breakout in AMD. Pattern gave clear entry, stop, and target levels.
Technical Indicators: The Supporting Cast
Momentum Indicators
Relative Strength Index (RSI):
- Oscillates between 0-100
- Above 70: Potentially overbought
- Below 30: Potentially oversold
- Divergences often signal reversals
Moving Average Convergence Divergence (MACD):
- Shows relationship between two moving averages
- Signal line crossovers generate buy/sell signals
- Histogram shows momentum
- Divergences predict trend changes
Stochastic Oscillator:
- Compares closing price to recent range
- %K line and %D line (smoothed)
- Overbought above 80, oversold below 20
- Best in ranging markets
Volume Indicators
On-Balance Volume (OVB):
- Running total of volume
- Up days add volume, down days subtract
- Should confirm price trends
- Divergences signal potential reversals
Volume Moving Average:
- Shows if current volume above/below average
- High volume confirms breakouts
- Low volume suggests weak moves
- Institutional activity shows up here
Trend-Following Indicators
Bollinger Bands:
- Moving average with standard deviation bands
- Price often bounces between bands
- Squeeze patterns often precede breakouts
- Band walks indicate strong trends
Average Directional Index (ADX):
- Measures trend strength (not direction)
- Above 25: Strong trend
- Below 20: Weak trend
- Rising ADX: Strengthening trend
Indicator philosophy: I use 2-3 indicators maximum. Too many create conflicting signals and paralysis by analysis.
Volume Analysis: The Truth Serum
Why Volume Matters
Volume represents conviction behind price moves:
- High volume = Strong conviction
- Low volume = Weak conviction
- Volume often leads price
- Institutions can't hide their footprints
Volume Patterns
Accumulation:
- Price stable or rising slowly
- Volume higher than average
- Smart money building positions
- Often precedes major moves up
Distribution:
- Price stable or falling slowly
- Volume higher than average
- Smart money exiting positions
- Often precedes major moves down
Climax Volume:
- Extremely high volume
- Often marks short-term extremes
- Selling climax = potential bottom
- Buying climax = potential top
Volume success story: Noticed unusual volume accumulation in Zoom before COVID announcement. Stock went from $70 to $550.
Market Structure: Reading Between the Lines
Market Phases
Accumulation Phase:
- Sideways trading after decline
- Smart money quietly buying
- Public still pessimistic
- Volume inconsistent
Markup Phase:
- Prices trending higher
- Public starting to notice
- Media coverage increasing
- Volume expanding
Distribution Phase:
- Sideways trading after advance
- Smart money quietly selling
- Public most optimistic
- Volume high but price stalling
Markdown Phase:
- Prices trending lower
- Public finally panicking
- Media coverage negative
- Volume highest on down days
Sector Rotation: Understanding which sectors lead at different market phases helps predict broader market direction.
Market Breadth:
- Advance/decline line
- New highs vs new lows
- Percentage of stocks above moving averages
- Helps confirm or question market direction
Risk Management Through Technical Analysis
Position Sizing Based on Chart Levels
The 2% Rule:
- Never risk more than 2% of capital on single trade
- Distance to stop-loss determines position size
- Closer stop = larger position
- Farther stop = smaller position
Example: $100,000 account, 2% risk = $2,000 maximum loss per trade. Stock at $50, stop at $45 = $5 risk per share = 400 shares maximum.
Stop-Loss Placement
Technical Stop-Loss Levels:
- Below support for long positions
- Above resistance for short positions
- Beyond recent swing points
- Outside pattern boundaries
Time-Based Stops:
- Exit if pattern doesn't work within expected timeframe
- Prevents capital from being tied up indefinitely
Profit Taking Strategies
Technical Targets:
- Pattern-based objectives
- Fibonacci extension levels
- Previous resistance becomes support
- Round number levels
Trailing Stops:
- Move stop up as price advances
- Protect profits while allowing for continued gains
- Can use moving averages as trailing stops
- Balance between giving room and protecting profits
Common Technical Analysis Mistakes
Mistake #1: Ignoring the Bigger Picture
- Trading against major trend
- Using wrong time frame for analysis
- Missing forest for trees
My error: Bought "oversold" bounces in 2008 bear market. Short-term signals meant nothing in major downtrend.
Mistake #2: Over-Relying on Indicators
- Using too many indicators
- Waiting for perfect setup
- Ignoring price action for indicators
Mistake #3: Drawing Lines to Fit Bias
- Seeing patterns that aren't there
- Cherry-picking data points
- Confirmation bias in line drawing
Mistake #4: Ignoring Volume
- Trading breakouts without volume confirmation
- Missing accumulation/distribution signals
- Not understanding institutional behavior
Mistake #5: Poor Risk Management
- No defined stop-loss levels
- Position sizes too large
- Not cutting losses quickly
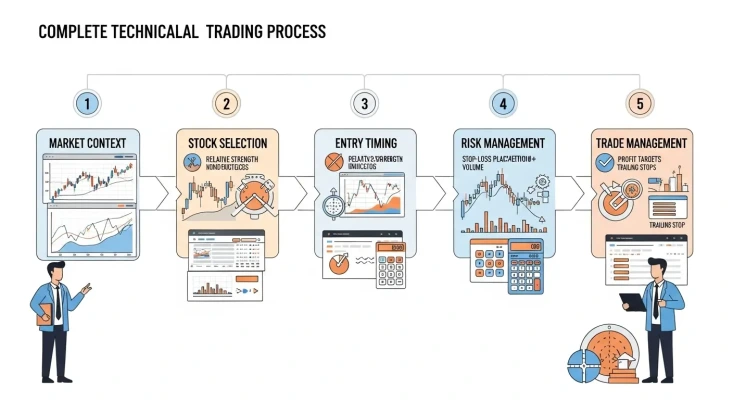
Putting It All Together: My Trading Process
 Step 1: Market Context
- What phase is overall market in?
- Are we in risk-on or risk-off environment?
- Which sectors are leading/lagging?
Step 2: Stock Selection
- Relative strength vs market
- Volume characteristics
- Technical pattern formation
Step 3: Entry Timing
- Wait for pattern completion
- Confirm with volume
- Enter on pullback to support
Step 4: Risk Management
- Define stop-loss before entry
- Calculate position size
- Set initial profit target
Step 5: Trade Management
- Monitor for pattern failure
- Trail stops as position moves favorably
- Take partial profits at targets
Building Your Technical Analysis Toolkit
Essential Tools:
Charting Software:
- TradingView (my favorite)
- StockCharts
- TC2000
- Broker platforms
Must-Know Patterns:
- Support and resistance
- Trend lines and channels
- Head and shoulders
- Triangles and flags
Key Indicators:
- Moving averages (20, 50, 200)
- RSI
- MACD
- Volume
Learning Resources:
- "Technical Analysis of the Financial Markets" by John Murphy
- "Japanese Candlestick Charting Techniques" by Steve Nison
- TradingView educational content
- Practice with paper trading
Your 90-Day Technical Analysis Journey
Days 1-30: Foundation
- Learn chart types and time frames
- Practice identifying support/resistance
- Understand basic candlestick patterns
- Start keeping trading journal
Days 31-60: Pattern Recognition
- Study major reversal patterns
- Learn continuation patterns
- Practice on historical charts
- Begin using indicators
Days 61-90: Application
- Start paper trading with real-time charts
- Develop personal trading rules
- Track performance and learn from mistakes
- Begin with small real money positions
Final Thoughts: The Art and Science of Charts
Technical analysis isn't about predicting the future – it's about understanding the present. Charts don't tell you what will happen, but they show you what is happening right now in terms of supply and demand, fear and greed, and the collective psychology of market participants.
After eight years of using technical analysis, I've learned that it's both an art and a science. The science is in the indicators, patterns, and measurable relationships. The art is in interpreting what they mean in context and having the discipline to act on your analysis.
The $25,000 I lost ignoring charts was expensive tuition, but it taught me that successful investing requires both fundamental analysis (to know what to buy) and technical analysis (to know when to buy it). You can have the best fundamental pick in the world, but if you buy it at the wrong time, you'll lose money.
Technical analysis has made me a more patient investor, a more disciplined trader, and ultimately, a more profitable participant in the markets. It won't make you right all the time – nothing will – but it will help you be wrong less often and right more profitably.
Start simple, stay disciplined, and remember: the chart never lies. It might not tell you everything you want to know, but it will tell you everything you need to know.
The market is the ultimate teacher. The charts are its textbook. Start reading.


Add Comment
No comments yet. Be the first to comment!