


Key Findings:
- Rental Growth: 4.3% annual increase, averaging $133 more per month
- Most Affordable Neighborhoods: Diamond Heights ($2,000/month), Tenderloin ($2,065/month)
- Most Expensive Neighborhoods: Rincon Hill ($4,414/month), Hayes Valley ($4,060/month)
- Market Status: Seller's market with high demand and low inventory
- Tech Impact: AI and tech sector stability driving renewed rental demand
Table Of Contents
- Current Market Overview
- Rental Market Deep Dive
- Home Buying Market
- Neighborhood-by-Neighborhood Analysis
- Transportation and Living Costs
- Tech Sector Impact
- 2025-2026 Market Predictions
- Investment Opportunities
- Practical Tips for Renters and Buyers
- Housing Policy and Regulations
- Living Costs Beyond Housing
- Market Comparison: San Francisco vs. Other Cities
- Seasonal Market Patterns
- Future Outlook and Conclusions
- Conclusion
Current Market Overview
 San Francisco's real estate market in 2025 is showing signs of stabilization after several years of pandemic-related volatility. The city remains one of the most expensive places to live in the United States, with housing costs significantly exceeding national averages.
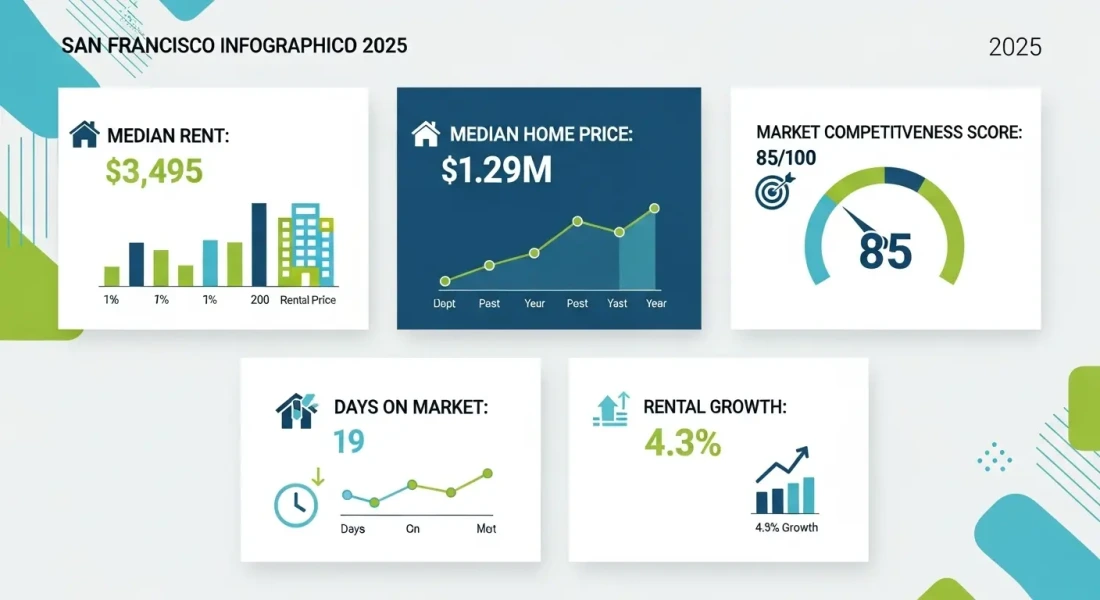
Key Statistics (June 2025)
| Metric | San Francisco | National Average | Difference |
|---|---|---|---|
| Median Rent (All Types) | $3,495 | $1,943 | +80% |
| Median Home Price | $1.29M | $422,800 | +205% |
| Average Rent per Sq Ft | $5.00 | $1.50 | +233% |
| Cost of Living Index | 90.3 | 50.0 | +81% |
Market Temperature
The San Francisco housing market scores 85 out of 100 on competitiveness scales, indicating a very competitive environment. Key indicators include:
- Days on Market: 19 days (down from 24 days last year)
- Homes Selling Above List: 49% of properties
- Market Type: Strong seller's market
- Inventory Levels: 1,600 homes available (12.4% decrease from May)
Rental Market Deep Dive
Current Rental Prices by Property Type
| Property Type | Average Monthly Rent | Year-over-Year Change |
|---|---|---|
| Studio | $2,274 - $2,334 | +0.3% |
| 1-Bedroom | $3,024 - $3,038 | +4.2% |
| 2-Bedroom | $3,703 - $4,178 | +0.6% |
| 3-Bedroom | $5,500 - $5,711 | +14.5% |
| 4-Bedroom | $6,448 | -23% |
Rental Market Trends
The San Francisco rental market in 2025 is demonstrating renewed strength after pandemic-era volatility. Several factors are driving this recovery:
Positive Drivers:
- Return of tech sector stability
- Increased return-to-office policies
- High barriers to homeownership keeping renters in the market
- Limited rental supply due to strict zoning regulations
Market Dynamics:
- Vacancy Rate: 6.3% (down 230 basis points year-over-year)
- Rental Yield: Strong cash flow performance expected
- Demand Centers: SoMa, Mission Bay, and Rincon Hill leading demand
- Supply Constraints: Delayed construction timelines contributing to scarcity
Rental Demographics
| Demographic | Percentage |
|---|---|
| Renter-Occupied Units | 62% (223,040 units) |
| Owner-Occupied Units | 38% (139,610 units) |
| Renters with Bachelor's+ | 63% |
| Family Households | 35% |
| Households with Children | 14% |
Home Buying Market
Current Home Sales Data
The San Francisco home buying market remains highly competitive despite economic headwinds. Here's the current landscape:
June 2025 Sales Statistics:
- Median Sale Price: $1,483,887 (up 3.8% from last year)
- Price per Square Foot: $971
- Homes Sold: 503 (down from 525 last year)
- Market Competition: 85/100 competitiveness score
Price Trends by Property Type
| Property Type | Median Price | Year-over-Year Change |
|---|---|---|
| Condos | $1.08M | +9.1% (recent rebound) |
| Single-Family Homes | $1.55M | +2.1% |
| Luxury Properties | $2M+ | Stable growth |
Market Conditions
Seller Advantages:
- High demand from high-income professionals
- Limited inventory creating competition
- Properties selling at or above asking price
- Quick sales (average 19 days on market)
Buyer Challenges:
- Mortgage rates around 6.63% (30-year fixed)
- High down payment requirements
- Multiple offer situations common
- Limited inventory selection
Neighborhood-by-Neighborhood Analysis
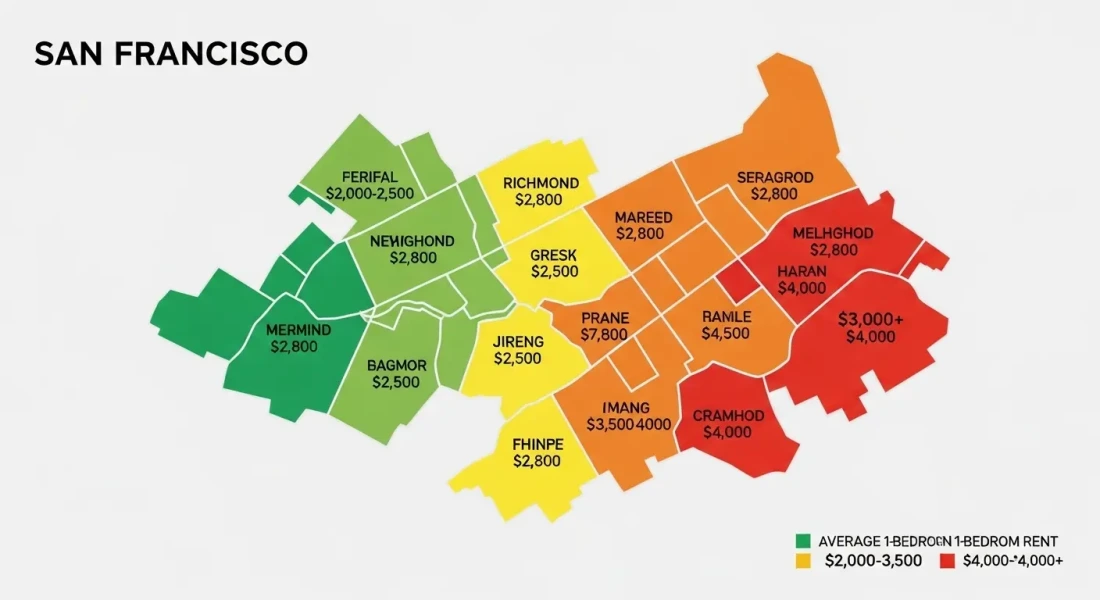
Most Affordable Neighborhoods
| Neighborhood | 1-BR Average Rent | Characteristics |
|---|---|---|
| Diamond Heights | $2,000 | Residential, family-friendly, great views |
| Tenderloin | $2,065 | Downtown location, urban challenges |
| Lower Nob Hill | $2,545 | Central location, improving area |
| Downtown/Union Square | $2,545 | Business district, tourist area |
| Alamo Square | $2,695 | Victorian architecture, parks |
Most Expensive Neighborhoods
| Neighborhood | 1-BR Average Rent | Key Features |
|---|---|---|
| Rincon Hill | $4,414 | Luxury high-rises, Bay Bridge views |
| Hayes Valley | $4,060 | Trendy restaurants, shopping |
| Mission Bay | $4,017 | New development, tech offices |
| Inner Sunset | $3,830 | Near Golden Gate Park |
| South of Market (SoMa) | $3,792 | Tech startup hub |
Popular/Trending Neighborhoods
Noe Valley ($3,695/month 1-BR)
- Family-friendly atmosphere
- Excellent schools
- Victorian homes
- Strong community feel
Mission Dolores ($2,999/month 1-BR)
- Historic district
- Vibrant nightlife
- Cultural diversity
- Good public transit access
Cole Valley ($3,095/month 1-BR)
- Quiet residential area
- Near UCSF medical center
- Easy access to Golden Gate Park
- Growing cafe culture
Pacific Heights
- Luxury neighborhood
- Stunning bay views
- High-end shopping
- Price drop of 40.6% year-over-year (market correction)
Emerging Areas
Outer Sunset - Growing demand, more affordable entry point Excelsior - Diverse community, improving accessibility Bayview/Visitacion Valley - Most affordable, development potential
Transportation and Living Costs
Public Transportation Overview
San Francisco's public transportation system consists of several integrated networks:
BART (Bay Area Rapid Transit)
- Connects SF to East Bay and Peninsula
- Current challenges: 50% of pre-pandemic ridership
- Potential service cuts: May reduce to hourly service
- Funding crisis: Facing massive budget shortfalls
MUNI (San Francisco Municipal Transportation)
- Local bus and light rail system
- Current ridership: 75% of pre-pandemic levels
- Facing $322 million deficit in 2026
- Youth 18 and under ride free (except cable cars)
Transportation Costs
| Service | Cost | Notes |
|---|---|---|
| MUNI Single Ride | $3.00 | Clipper card required |
| MUNI Monthly Pass | $81 | Unlimited rides |
| BART (varies by distance) | $3-15+ | Depends on destination |
| Cable Car | $8 | Tourist-focused |
| Parking (downtown) | $4-8/hour | Highly variable |
Transportation Funding Crisis
Both MUNI and BART are facing existential funding challenges:
Proposed Solutions:
- Regional sales tax (0.5-1 cent) in 2026 ballot measure
- Congestion pricing during peak hours
- Uber/Lyft pickup fees
- Increased parking fees
- Express toll lanes
Impact on Housing:
- Transportation costs significantly affect housing affordability
- Areas with good transit access command premium rents
- Potential service cuts could impact neighborhood desirability
Tech Sector Impact
Current Tech Employment Trends
The tech sector continues to be a major driver of San Francisco's housing market, though with notable changes:
Key Statistics:
- Information industry jobs: 107,700 (lowest since June 2020)
- 25,400 tech jobs lost since August 2022 peak (-19%)
- Professional/Scientific services: Down 21,600 jobs since June 2022
- AI and tech hiring showing renewed growth in 2025
Tech Workers and Housing Demand
Factors Supporting Housing Demand:
- High-income tech professionals ($150K+ average salaries)
- Return-to-office policies increasing city presence
- AI sector growth bringing new workers
- Hybrid work models concentrating demand in central areas
Impact on Neighborhoods:
- SoMa: Tech startup hub, high rental demand
- Mission Bay: Corporate offices, luxury housing
- Rincon Hill: High-rise living for tech workers
- Hayes Valley: Popular with young professionals
Remote Work Effects
The shift to hybrid work has created new dynamics:
- Reduced demand for immediate downtown proximity
- Increased interest in neighborhoods with better quality of life
- Some workers relocating to more affordable Bay Area suburbs
- Continued preference for well-connected transit areas
2025-2026 Market Predictions
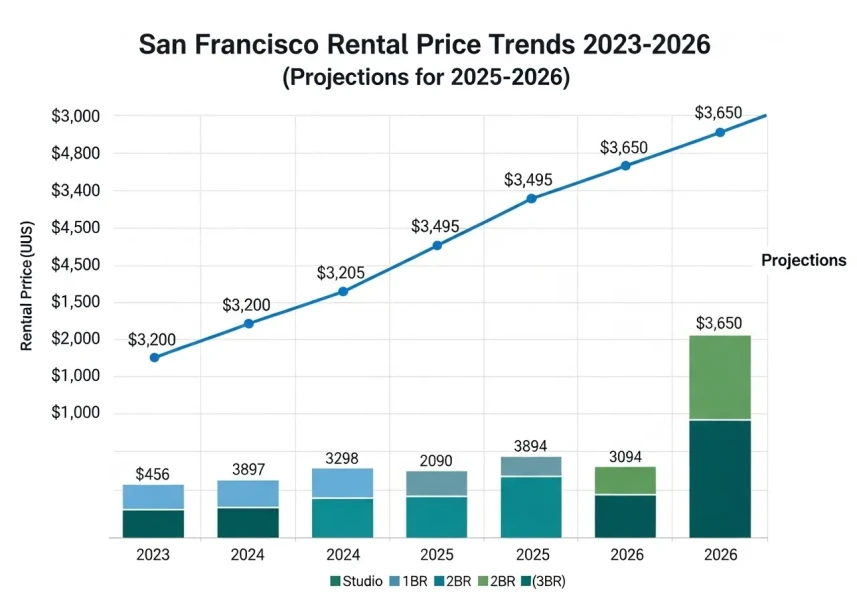
Rental Market Forecast
Expected Trends:
- Continued moderate rent growth (3-5% annually)
- Vacancy rates to decline further to around 3%
- Strong performance in mid-tier neighborhoods
- Tech sector stability driving sustained demand
Neighborhood Predictions:
- Growth Leaders: Outer Sunset, Excelsior, Richmond
- Stable Premium: Pacific Heights, Noe Valley, Bernal Heights
- Recovery Areas: Downtown/SoMa benefiting from office return
Home Sales Forecast
Price Predictions:
- 2025: 1.8% growth (current trend)
- 2026: 2.5-3.8% additional growth
- Median price projection: $1.32-1.34 million by early 2026
Market Dynamics:
- Continued seller's market conditions
- Modest inventory improvements expected
- Mortgage rates stabilizing around 6%
- Sustained demand from high-income buyers
Economic Factors
Supporting Growth:
- AI and green energy job creation
- Healthcare sector expansion
- Renewed venture capital activity
- Infrastructure investments
Potential Headwinds:
- Interest rate volatility
- Economic uncertainty
- Housing policy changes
- Transportation funding crisis
Investment Opportunities
Rental Investment Prospects
Best Opportunities:
- Mid-Market Neighborhoods: Outer Richmond, Sunset, Excelsior
- Transit-Accessible Areas: Near BART/MUNI lines
- Emerging Areas: Bayview, Visitacion Valley
- Multi-Unit Properties: Better cash flow potential
Investment Metrics
| Investment Type | Expected Return | Risk Level | Entry Cost |
|---|---|---|---|
| Single-Family Rental | 4-6% yield | Medium | $1.3M+ |
| Condo Rental | 3-5% yield | Medium-High | $800K+ |
| Multi-Unit Building | 5-8% yield | High | $2M+ |
| Commercial Real Estate | 6-10% yield | High | $3M+ |
Investment Considerations
Advantages:
- Strong rental demand
- Limited supply supporting values
- Diverse, high-income tenant base
- Long-term appreciation potential
Challenges:
- High entry costs
- Complex regulations
- Rent control considerations
- Property management challenges
Practical Tips for Renters and Buyers
For Renters
Finding Affordable Options:
- Consider neighborhoods like Diamond Heights, Tenderloin, or Outer districts
- Look for studios or shared living situations
- Search during winter months (3.4% lower prices)
- Negotiate on longer lease terms
- Consider areas with good public transit to reduce overall costs
Budget Planning:
- Expect to pay 30-50% of income on rent
- Budget additional $200-400/month for utilities
- Factor in transportation costs ($100-200/month)
- Security deposits typically 1-2 months rent
Rental Process Tips:
- Have complete application ready (credit report, references, proof of income)
- Apply quickly in competitive markets
- Consider guarantor if income is borderline
- Understand tenant rights and rent control laws
For Buyers
Financial Preparation:
- Save 20-25% down payment ($250K+ for median home)
- Maintain credit score above 740
- Income should be 4-5x home price
- Pre-approval essential in competitive market
Home Search Strategy:
- Work with experienced local agent
- Be prepared to act quickly (offers in 1-2 days)
- Consider slightly less popular neighborhoods
- Factor in renovation costs for older properties
Negotiation Tactics:
- Escalation clauses in competitive situations
- Waive contingencies if confident (inspect beforehand)
- Personal letters to sellers can help
- Be flexible on closing timeline
Housing Policy and Regulations
Rent Control Laws
San Francisco has some of the strongest tenant protections in the nation:
Rent Stabilization Ordinance:
- Applies to buildings built before June 1979
- Annual rent increases limited (typically 1-3%)
- Just cause eviction protections
- Tenant buyout regulations
Zoning and Development
Current Challenges:
- Strict zoning limiting new construction
- Lengthy approval processes
- Community opposition to density
- Environmental review requirements
Recent Reforms:
- SB 9 allowing duplexes in single-family zones
- Accessory Dwelling Unit (ADU) streamlining
- Transit-oriented development incentives
- Affordable housing requirements
Future Policy Directions
Under Consideration:
- Zoning reform for increased density
- Affordable housing bond measures
- Commercial-to-residential conversions
- Short-term rental regulations
Living Costs Beyond Housing
Essential Expenses
| Category | Monthly Cost | Notes |
|---|---|---|
| Groceries | $400-600 | 20-30% above national average |
| Utilities | $150-250 | Electric, gas, internet, phone |
| Transportation | $100-300 | Depends on car ownership |
| Healthcare | $300-500 | Varies by insurance |
| Dining Out | $300-600 | Wide range of options |
| Entertainment | $200-400 | Museums, events, activities |
Salary Requirements
To live comfortably in San Francisco (covering all expenses plus savings):
| Household Type | Recommended Income |
|---|---|
| Single Person | $150,000-200,000 |
| Couple (no children) | $250,000-300,000 |
| Family of Four | $350,000-400,000 |
These figures assume spending about 30% of income on housing and maintaining a reasonable quality of life.
Market Comparison: San Francisco vs. Other Cities
Bay Area Comparison
| City | Median Rent | Median Home Price | Comparison to SF |
|---|---|---|---|
| San Francisco | $3,495 | $1.29M | Baseline |
| Oakland | $2,800 | $850K | 20% lower rent, 35% lower purchase |
| San Jose | $3,200 | $1.4M | 8% lower rent, 8% higher purchase |
| Berkeley | $2,900 | $1.1M | 17% lower rent, 15% lower purchase |
National Comparison
| City | Cost of Living Index | Housing Cost Ratio |
|---|---|---|
| San Francisco | 90.3 | 205% above national average |
| New York | 100.0 | 251% above national average |
| Los Angeles | 75.2 | 180% above national average |
| Seattle | 72.8 | 175% above national average |
| Austin | 58.3 | 120% above national average |
Seasonal Market Patterns
Best Times to Rent
Winter (December-February):
- 3.4% lower rental prices
- Less competition from other renters
- Landlords more willing to negotiate
Spring/Summer (March-August):
- Peak rental season
- Highest prices and competition
- Best selection of available units
Best Times to Buy
Fall/Winter:
- Reduced competition
- Motivated sellers
- Better negotiating position
Spring:
- Largest inventory selection
- More competitive but better choice
Future Outlook and Conclusions
Long-Term Trends
Factors Supporting Continued Growth:
- Economic Fundamentals: Strong job market in tech, healthcare, finance
- Supply Constraints: Geographic and regulatory limits on new construction
- Global Appeal: International investment and immigration
- Innovation Hub: Continued attraction for startups and established companies
Potential Challenges:
- Affordability Crisis: Risk of losing middle-class residents
- Transportation Issues: Funding crisis threatening mobility
- Policy Responses: Potential rent control or development restrictions
- Climate Risks: Sea level rise and natural disaster considerations
Investment Outlook
San Francisco real estate remains attractive for long-term investors despite high entry costs:
Strengths:
- Consistent appreciation over decades
- Strong rental demand
- Limited supply growth
- Diverse economy
Risks:
- High volatility potential
- Regulatory changes
- Economic downturns
- Competition from other Bay Area cities
Recommendations
For Renters:
- Budget conservatively for housing costs
- Consider roommates or less central locations
- Build strong rental history and credit
- Stay informed about tenant rights
For Buyers:
- Focus on long-term ownership (5+ years)
- Consider slightly less popular neighborhoods
- Factor in all costs including HOA, taxes, maintenance
- Work with experienced local professionals
For Investors:
- Target areas with good transit access
- Consider multi-unit properties for better returns
- Understand local regulations thoroughly
- Plan for long-term hold strategies
Conclusion
San Francisco's housing and rental market in 2025 presents both opportunities and challenges. While costs remain among the highest in the nation, the market is showing signs of stabilization after years of volatility. The tech sector's recovery, combined with limited supply and strong fundamentals, continues to support property values and rental demand.
For those considering San Francisco, success requires careful financial planning, thorough market research, and realistic expectations about costs. Whether renting or buying, the key is to understand that San Francisco housing is a premium market requiring premium resources.
The city's unique combination of economic opportunity, cultural richness, and geographic beauty continues to attract residents despite high costs. For those who can navigate the market successfully, San Francisco offers an unparalleled urban living experience with strong long-term prospects.
As the market evolves through 2025 and beyond, staying informed about policy changes, economic trends, and neighborhood developments will be crucial for making sound housing decisions in this dynamic and competitive market.
Data sources: Zumper, RentCafe, Apartments.com, Redfin, Zillow, SF Planning Department, SFMTA, and various real estate industry reports as of June-July 2025.
Add Comment
No comments yet. Be the first to comment!